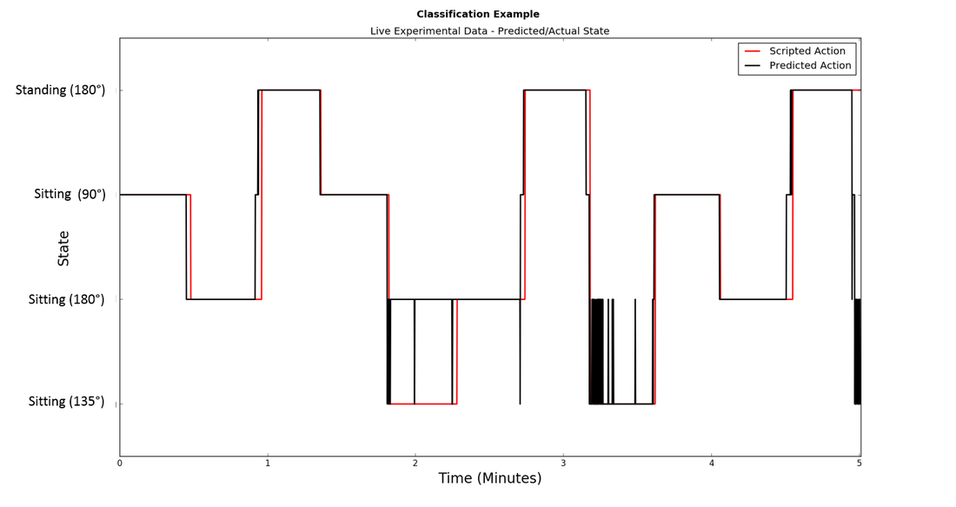
'The plot below shows the comparison of the 4 different classified states for the Test Data, based on the SVM's prediction vs the data's true state. The black line is the predicted classification while the red line shows the actual labeled state. The error between the predicted and actual states is quite small for the Standing(180 deg), Sitting (180 deg), and the Sitting (190 deg) states. For the Sitting(135 deg) state when the user's leg is stretched out at 135 degrees with respect to his torso (45 degrees with the floor) the classifier occasionally gets confused and thinks that the legs were horizontal at 180 degrees. This is probably because the accelerometer values used to train the data are too similar for both states. As the knee is completely extended straight in both cases the SVM was having difficulty telling when the leg was resting horizontally and when it was stretched out at the 135 degrees.
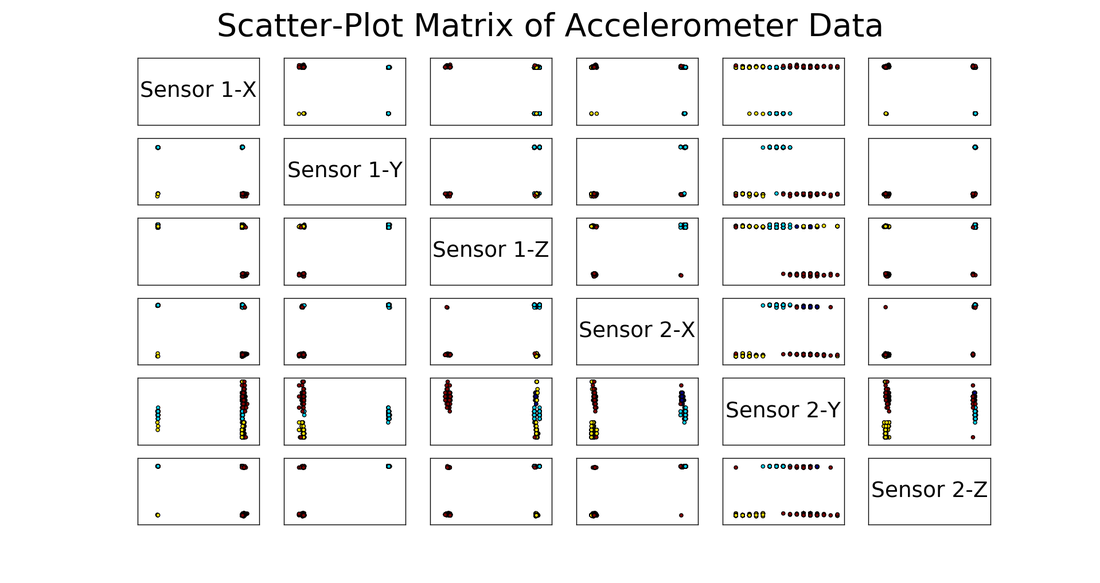
The figure below displays several subplots with data from both WICED sensors (Sensor 1 - Above the Knee, Sensor 2 - Below the Knee). Accelerometer data is filtered and adjusted for errors using the corresponding gyroscope data in that particular direction. The first column shows the separation present when Sensor 1's X-direction accelerometer data is compared to itself, Sensor 1's Y accelerometer data, Sensor 1's Z accelerometer data, Sensor 2's X accelerometer data, Sensor 2's Y Accelerometer data, and Sensor 2's Z Accelerator Data. Column 2 presents Sensor 1's Y-direction accelerometer data compared to itself, Sensor 1's X accelerometer data, Sensor 1's Z accelerometer data, etc. The four state classes are clearly present in all 36 subplots, thus making it evident that linear separability is (generally) achievable across all four states.
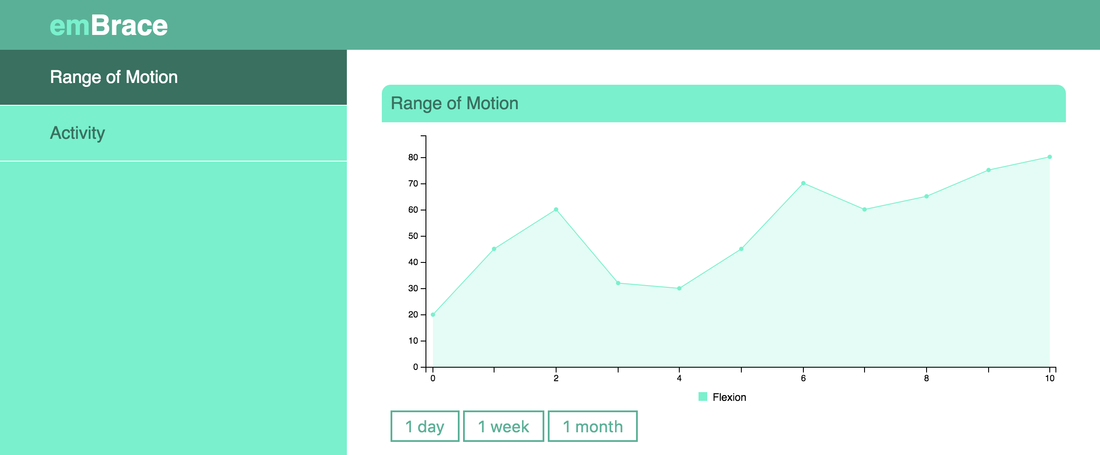
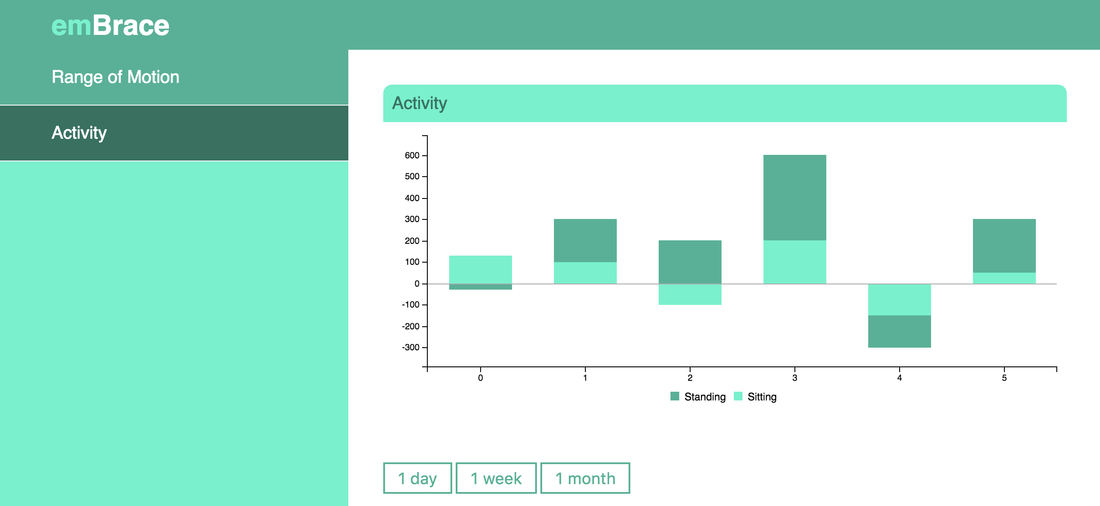
The emBRACE tool's web application allows the user (and the user's doctor) to access relevant visualizations regarding past and present activity. Two metrics are presented for the user: Range of Motion and Activity State. Range of Motion represents knee angle while Activity State identifies whether the user was sitting or standing. These two features are plotted along different time frames: day, week and month, to provide a thorough set of data to review during recovery. Sample plots are seen below.